My Account
My Slides
Leave Feedback
Login
Logout
Get Started
Browse all Slides
Browse Slides Pro
Create a FREE Account
Instant access to 1,000+ real slides from top companies like McKinsey, BCG, Goldman Sachs, Google and many more!
First Name
Last Name
Email
Password
I agree to all
Terms & Privacy Policy
Thank you! Your submission has been received!
Oops! Something went wrong while submitting the form.
Have an account?
Sign in
Saved Slides
Total No. of slides saved
0
↻ Refresh
✖ Clear all
A U.S. map highlights locations and prospective clients in the Middle Market Banking & Specialized Industries sector, using color-coding to differentiate data. The slide is data-driven and informative with minimal text for clarity.
Market Analysis and Trends
Financial Services
Offers a geographical overview of opportunities in the Middle Market segment, ideal for strategic discussions or investor presentations focused on expansion and market potential.
Middle Market, client franchise, growth opportunity, geographical overview, market potential
false
Market Analysis and Trends
Financial Services
Graphic
JP Morgan
Add to my slides
Remove from favorites
A U.S. map pinpointing U.S. Bank and State Farm locations, alongside line graphs showcasing crypto fund flows and the number of new accounts, using red and blue colors.
Strategic Planning
Financial Services
Outlines strategic partnerships with State Farm and NYDIG, detailing the expansion of deposit accounts and the introduction of cryptocurrency custody services, reflecting diversification and digital advancement strategies.
Strategic Partnerships, Crypto, State Farm
false
Strategic Planning
Financial Services
Multiple Chart
Goldman Sachs
Add to my slides
Remove from favorites
A UK map highlights different regions with associated GVA and employment figures in a legible format. Side text provides additional context and notes.
Market Analysis and Trends
Government & Public Sector
This slide details the regional economic impact of the Tempest programme, showcasing direct and indirect GVA and employment contributions across the UK.
regional impact, Tempest programme, GVA, employment, UK regions, economic contribution
false
Market Analysis and Trends
Government & Public Sector
Single Chart
PwC/Strategy&
Add to my slides
Remove from favorites
A Venn diagram centralizes the slide, flanked by bulleted text that presents the bank's criteria, competitive advantages, and value proposition. The layout is engaging, using color to differentiate between elements.
Technology and Digital Transformation
Financial Services
The slide provides insights into the firm's vision and strategic criteria for establishing a leading digital consumer bank, emphasizing its strengths and customer-centric value proposition.
digital banking, consumer finance, strategy, value proposition
false
Technology and Digital Transformation
Financial Services
Table
Goldman Sachs
Add to my slides
Remove from favorites
A Venn diagram overlaid on a faded gray square grid background with additional descriptive text.
Strategic Planning
Financial Services
Showcases the firm's multifaceted approach in the innovation economy with activities like advising, raising capital, and investing.
innovation economy, strategic approach, advising, capital, investing, co-creation, Goldman Sachs
false
Strategic Planning
Financial Services
Framework
Goldman Sachs
Add to my slides
Remove from favorites
A balance of text and graphics, showing the bank's strengths and how it aligns with J.P.Morgan's strategies, accompanied by a pie chart.
Mergers and Acquisitions
Financial Services
Slide compares the business models of First Republic Bank and J.P.Morgan, focusing on client service, credit performance, and strategic alignment. Suitable for M&A context or business model comparison.
First Republic Bank, client service, credit performance, strategic alignment, loan portfolio, high-growth markets, talent acquisition
false
Mergers and Acquisitions
Financial Services
Mixed Chart
JP Morgan
Add to my slides
Remove from favorites
A balanced layout featuring a pie chart on the right about self-assessed generative AI expertise and a column of text on the left. Color scheme is green and white.
Market Analysis and Trends
Technology & Software
Slide shows confidence among leaders in their organizations' generative AI expertise, with a pie chart visualizing the levels of self-assessed expertise across surveyed respondents.
Generative AI, Expertise, Confidence, Survey
false
Market Analysis and Trends
Technology & Software
Mixed Chart
Deloitte
Add to my slides
Remove from favorites
A balanced layout with three pie charts on the left and a list of bullet points on the right. The slide uses consistent color coding to categorize different investment types and geographic allocations.
Financial Performance
Financial Services
This slide examines the diversified portfolio and investment strategies, detailing the benefits for clients and shareholders, along with geographical distribution and asset class breakdown of the firm’s balance sheet investments.
Balance Sheet, Diversification, Portfolio, Investments
false
Financial Performance
Financial Services
Multiple Chart
Goldman Sachs
Add to my slides
Remove from favorites
A balanced layout with two distinct sections: textual content on the left explaining reasons for brand switching and a comparative visual on the right indicating these reasons across different Southeast Asian countries.
Customer and Market Segmentation
Retail & E-commerce
The slide provides insights into the primary factors influencing brand-switching decisions, such as reliability and value for money, and compares these factors across different Southeast Asian markets, emphasizing the role of perceived value and product quality.
brand reliability, value for money, consumer insights, brand switching, Southeast Asia, market comparison, product quality, consumer decisions
false
Customer and Market Segmentation
Retail & E-commerce
Boxed
Bain
Add to my slides
Remove from favorites
A balanced layout with two distinct sections—one for productivity and one for customer experience—each with relevant icons and bullet points. The slide is visually balanced and focuses on different aspects of business improvement.
Operational Efficiency
Technology & Software
This slide underscores the importance of productivity and customer experience in the digital age, indicating a need for skilled talent to enhance these areas. It likely serves to motivate the investment in digital talent to drive such improvements within companies.
productivity, customer experience, digital age, talent, business improvement
false
Operational Efficiency
Technology & Software
Header Horizontal
Kearney
Add to my slides
Remove from favorites
A balanced slide comparing four elements of profitability drivers: market share, value-added services, private label, and sales strategy, with descriptive bullet points for each.
Strategic Planning
Financial Services
Discusses the different drivers of profitability for a company including market position and sales strategies, useful for strategic business planning.
profitability, market share, value-added, private label, sales strategy, operational efficiency, business growth
false
Strategic Planning
Financial Services
Pillar
EY
Add to my slides
Remove from favorites
A bar chart and a pie chart showing consumer interest in various connected vehicle services and their willingness to pay for these services. The layout is clean and informative.
Technology and Digital Transformation
Transportation & Logistics
This slide discusses consumer interest in connected vehicle services related to traffic updates, safety, and maintenance, and their willingness to invest in these technologies. It highlights a low willingness to pay extra.
Connected services, consumer behavior, digital transformation, vehicle technology
false
Technology and Digital Transformation
Transportation & Logistics
Multiple Chart
Deloitte
Add to my slides
Remove from favorites
A bar chart and bullet points detailing reasons highly skilled workers consider job changes.
Human Resources and Talent Management
Professional Services
Analyzes the motivations for job changes among highly skilled workers, including pay, career progression, and work environment.
Job change, skilled workers, career progression, work environment
false
Human Resources and Talent Management
Professional Services
Mixed Chart
Accenture
Add to my slides
Remove from favorites
A bar chart compares the ICT market size in 2021 and projected growth in 2026 across ASEAN countries. The slide background is dark red with a maroon header.
Market Analysis and Trends
Technology & Software
The slide predicts a substantial increase in digital talent demand aligned with the ICT market growth in ASEAN countries, useful for strategic planning in talent management.
ICT market, digital talent, ASEAN, market growth, talent management, 2026 projection
false
Market Analysis and Trends
Technology & Software
Multiple Chart
Kearney
Add to my slides
Remove from favorites
A bar chart compares the needs of smaller vs. larger companies in areas like AI, HR, and sales to meet business priorities.
Operational Efficiency
Professional Services
Highlights different strategic needs for productivity improvements across various business sectors, focusing on technology and HR.
productivity, technology, HR, sales, strategies
false
Operational Efficiency
Professional Services
Single Chart
Deloitte
Add to my slides
Remove from favorites
A bar chart compares the time spent on gaming during and after the pandemic across various consumer segments. The design is straightforward with a clear visual distinction between the periods.
Market Analysis and Trends
Media & Entertainment
Examines changes in gaming behavior post-pandemic across different consumer groups, emphasizing a decrease in gaming time compared to pandemic peaks.
gaming, pandemic, consumer behavior, time spent, affluent users, digital natives, suburban users
false
Market Analysis and Trends
Media & Entertainment
Single Chart
Bain
Add to my slides
Remove from favorites
A bar chart comparing Millennials and Gen Z on financial prudence and ability to cope with financial crises, with percentage indicators for various financial metrics.
Financial Performance
Financial Services
This slide examines long-term financial concerns and short-term financial comfort among Millennials and Gen Z, focusing on their ability to handle financial crises.
Financial concerns, short-term comfort, Millennials, Gen Z, financial prudence, financial metrics, comparison, financial crisis
false
Financial Performance
Financial Services
Mixed Chart
Deloitte
Add to my slides
Remove from favorites
A bar chart comparing Millennials and Gen Z on financial responsibility, with various metrics such as budgeting, knowledge level, and financial goals.
Financial Performance
Financial Services
The slide highlights the financial responsibility of Millennials and Gen Z, comparing their budgeting habits, knowledge, and financial goal setting.
Financial responsibility, Millennials, Gen Z, budgeting, financial knowledge, financial goals, comparison, financial habits
false
Financial Performance
Financial Services
Mixed Chart
Deloitte
Add to my slides
Remove from favorites
A bar chart comparing Millennials and Gen Z on their views about climate change, with agree/disagree metrics on whether it is too late to repair the damage.
Market Analysis and Trends
Environmental Services & Sustainability
The slide examines the views of Millennials and Gen Z on the possibility of reversing climate change damage, comparing their levels of agreement and disagreement.
Climate change, Millennials, Gen Z, agreement, disagreement, environmental views, damage reversal, sustainability, comparison
false
Market Analysis and Trends
Environmental Services & Sustainability
Mixed Chart
Deloitte
Add to my slides
Remove from favorites
A bar chart comparing different industries' approaches to culture and organizational structure in 2026, using colors to differentiate between 'control', 'hybrid', and 'culture' focused models. The layout is straightforward with clearly labeled categories and percentages, enabling easy comparison across industries.
Market Analysis and Trends
Professional Services
Forecasting future trends, this slide compares industries' approaches to organizational structure for 2026. It reveals preferences for control, hybrid, or culture models within sectors like consumer goods, retail, and media, providing a comprehensive overview of anticipated shifts in organizational strategy influenced by cultural considerations.
organizational culture, 2026 forecast, industry comparison, structure models, consumer goods, retail, media
false
Market Analysis and Trends
Professional Services
Single Chart
Kearney
Add to my slides
Remove from favorites
A bar chart comparing global customers and a line chart detailing mobile app downloads by quarter, showcasing growth trends.
Market Analysis and Trends
Financial Services
The slide provides a comparative analysis of global customer base and app download metrics, emphasizing the company's competitive position and market share growth within the mobile app space.
global, mobile apps, growth, market share, financial platforms
false
Market Analysis and Trends
Financial Services
Multiple Chart
Barclays
Add to my slides
Remove from favorites
A bar chart comparing sources of anxiety and stress among Millennials and Gen Z, with categories such as family welfare, financial future, and job prospects.
Market Analysis and Trends
Professional Services
This slide analyzes the primary sources of anxiety and stress among Millennials and Gen Z, comparing various factors like family welfare and financial future.
Anxiety, stress, Millennials, Gen Z, comparison, sources, family welfare, financial future, job prospects
false
Market Analysis and Trends
Professional Services
Mixed Chart
Deloitte
Add to my slides
Remove from favorites
A bar chart comparing the relative streaming minutes versus Netflix for various platforms in Q4 2021. Platforms are listed on the x-axis with percentages representing their relative minutes viewed compared to Netflix, which is set at 100%.
Market Analysis and Trends
Media & Entertainment
This slide compares the relative streaming minutes of different platforms to Netflix in Q4 2021, indicating Netflix's dominance and the performance of other services like YouTube, Hulu, Amazon, Disney Plus, and others.
streaming minutes, platform comparison, Netflix, Q4 2021, Nielsen gauge
false
Market Analysis and Trends
Media & Entertainment
Single Chart
Nielsen
Add to my slides
Remove from favorites
A bar chart depicting the perceived effectiveness of digital paid channels like email, search, and social media. Each bar is segmented by confidence levels among marketers, similar to the previous slide.
Market Analysis and Trends
Media & Entertainment
This slide provides insights into marketers' confidence in the effectiveness of various digital paid media channels. It includes data on channels like email, search, and social media, showing how marketers rate their effectiveness.
Digital, Media, Effectiveness, Channels, Confidence
false
Market Analysis and Trends
Media & Entertainment
Mixed Chart
Nielsen
Add to my slides
Remove from favorites
A bar chart depicts consumer expectations for BEV driving range, categorized by urban and sub-urban/rural responses, showing varying preferences.
Market Analysis and Trends
Transportation & Logistics
Discusses consumer expectations for battery electric vehicle (BEV) driving ranges, essential for understanding market needs and vehicle design in the automotive sector.
BEV, driving range, consumer expectations, urban, rural, market needs, vehicle design, automotive trends
false
Market Analysis and Trends
Transportation & Logistics
Single Chart
Deloitte
Add to my slides
Remove from favorites
A bar chart detailing the issues faced by users of crypto trading platforms in 2023 and 2022, with categories like withdrawal issues, fee misunderstandings, and hacking.
Customer and Market Segmentation
Financial Services
This slide presents user-reported issues experienced on crypto trading platforms, comparing data from 2023 and 2022.
Experiences, issues, crypto, trading, platforms, 2023, 2022
false
Customer and Market Segmentation
Financial Services
Mixed Chart
IPSOS
Add to my slides
Remove from favorites
A bar chart details the proportion of female and male graduates in various fields of study between 2010-2019, using two different shades to distinguish genders.
Market Analysis and Trends
Education & Training
Reviews the gender distribution among tertiary graduates in various fields from 2010 to 2019, emphasizing the dominance of women in fields like education and health and their underrepresentation in STEM fields.
gender, graduates, fields, STEM, distribution
false
Market Analysis and Trends
Education & Training
Mixed Chart
Roland Berger
Add to my slides
Remove from favorites
A bar chart displaying preferred loan and lease durations for vehicle financing, in shades of blue. Well-organized and easy to interpret.
Financial Performance
Transportation & Logistics
This slide details consumer preferences for the duration of vehicle financing terms, emphasizing a trend towards longer terms for loans and leases to manage monthly payments effectively.
Financing terms, consumer preferences, loan duration, lease duration, financial planning
false
Financial Performance
Transportation & Logistics
Single Chart
Deloitte
Add to my slides
Remove from favorites
A bar chart displaying the number of correct answers to financial knowledge questions among investors, with textual data highlighting demographics more likely to score perfectly.
Human Resources and Talent Management
Financial Services
Discusses the financial knowledge of Canadian investors, showing the distribution of correct answers to financial questions and highlighting demographics with higher perfect scores.
financial knowledge, investors, questions, scores
false
Human Resources and Talent Management
Financial Services
Mixed Chart
IPSOS
Add to my slides
Remove from favorites
A bar chart displays the annual growth rate of technology subsectors, with color-coding to distinguish the top and bottom performers. Key technology subsectors are listed for context.
Investment Analysis
Technology & Software
The slide delves into the growth of annual deal values within technology subsectors, presenting a broad base of growth since 2013. It identifies specific areas with notable increases, such as AI and blockchain, and contrasts them with subsectors that have seen a decline, thereby offering a nuanced view of the sector's investment landscape.
technology subsectors, deal value growth, investment trends, AI, blockchain
false
Investment Analysis
Technology & Software
Single Chart
Oliver Wyman
Add to my slides
Remove from favorites
A bar chart displays the percentage of investors' expectations for the duration of the shift from growth to value investing. Text boxes and a source citation are included.
Market Analysis and Trends
Financial Services
This slide visualizes investors' expectations for the shift from growth to value investing over various time periods. It is useful for analyzing investment trends and strategizing.
investors, expectations, growth, value, trends
false
Market Analysis and Trends
Financial Services
Single Chart
BCG
Add to my slides
Remove from favorites
A bar chart highlighting the potential economic impact of a skills crisis, with key points summarized in text. The color scheme is purple and teal against a white background.
Risk Assessment and Management
Education & Training
The slide quantifies the potential economic loss to G20 countries due to a skills crisis and stresses the need for investment in education and technology.
Skills Crisis, G20, Economic Impact, Education Investment, Technology, GDP Growth, Risk Management, Labor Market, Forecast
false
Risk Assessment and Management
Education & Training
Single Chart
Accenture
Add to my slides
Remove from favorites
A bar chart illustrating the perceived effectiveness of various traditional paid media channels like linear TV, radio, and print. Each bar is segmented to show different confidence levels among marketers.
Market Analysis and Trends
Media & Entertainment
This slide presents survey data on marketers' confidence in the effectiveness of traditional paid media channels. It highlights the perceived effectiveness of channels like TV, radio, and print for brand building and consumer acquisition.
Media, Effectiveness, Traditional, Channels, Confidence
false
Market Analysis and Trends
Media & Entertainment
Mixed Chart
Nielsen
Add to my slides
Remove from favorites
A bar chart listing the top Netflix original shows in Q4 2021 by the number of weeks they appeared in the Nielsen Top 10. The chart uses bars of varying lengths to represent the number of weeks, with a legend for reference.
Competitive Landscape
Media & Entertainment
This slide lists the top Netflix original shows in Q4 2021, indicating how many weeks each show appeared in the Nielsen Top 10. It highlights the popularity and staying power of these shows during the quarter.
Netflix originals, top shows, Nielsen Top 10, weekly appearance, Q4 2021
false
Competitive Landscape
Media & Entertainment
Single Chart
Nielsen
Add to my slides
Remove from favorites
A bar chart listing various measures companies have taken to address the energy crisis, with highlighted percentages and an explanatory text box.
Risk Assessment and Management
Financial Services
The slide details the impact of the energy crisis on business investments and lists the measures companies have implemented to mitigate these effects.
energy crisis, investment, business measures, Europe
false
Risk Assessment and Management
Financial Services
Mixed Chart
EY
Add to my slides
Remove from favorites
A bar chart listing various supply chain transformation measures, with highlighted percentages and an explanatory text box.
Strategic Planning
Financial Services
The slide explores how supply chain reconfiguration and friendshoring can drive investment in Europe, presenting survey data on companies' supply chain strategies.
supply chain, investment, Europe, friendshoring
false
Strategic Planning
Financial Services
Mixed Chart
EY
Add to my slides
Remove from favorites
A bar chart on the left shows typical indirect spend per category, with pie charts on the right indicating Commercial and Demand management focus.
Operational Efficiency
Professional Services
This slide depicts typical indirect spend by category (Professional Services, Human Resource, etc.) and their focus on Commercial and Demand management.
Indirect spend, categories, commercial, demand management, bar chart, pie chart
false
Operational Efficiency
Professional Services
Single Chart
EY
Add to my slides
Remove from favorites
A bar chart outlines the top macro risk factors for investors, with changes from a previous survey period marked, highlighting interest rates, geopolitical risks, and inflation.
Risk Assessment and Management
Financial Services
Evaluates major macro risk factors considered by investors, with emphasis on how perceptions have shifted over recent periods. Useful for risk management and strategic investment planning.
risks, investors, macro factors, interest rates, inflation
false
Risk Assessment and Management
Financial Services
Single Chart
BCG
Add to my slides
Remove from favorites
A bar chart presents the prioritization of factors by investors for ensuring financial health in companies, emphasizing revenue protection and cash flow management.
Strategic Planning
Financial Services
Discusses key strategies that investors believe should be prioritized to maintain financial health in companies, especially in challenging economic conditions. Useful for strategic financial planning.
financial health, strategies, investors, prioritization, resilience
false
Strategic Planning
Financial Services
Single Chart
BCG
Add to my slides
Remove from favorites
A bar chart showing potential reach of the TV screen by source for different age groups, with a focus on AVOD reach and its incremental gain.
Market Analysis and Trends
Media & Entertainment
The slide highlights that AVOD content has the greatest reach potential among younger viewers, showing significant incremental gains in audience reach.
AVOD, reach, potential, younger viewers, incremental gain
false
Market Analysis and Trends
Media & Entertainment
Multiple Chart
Nielsen
Add to my slides
Remove from favorites
A bar chart showing real GDP growth in selected economies for 2024 under baseline and higher-for-longer scenarios, with detailed text analysis on inflation, central bank policies, and economic conditions.
Risk Assessment and Management
Financial Services
This slide analyzes a higher-for-longer scenario where delayed easing by central banks amid sticky inflation trends could lead to recessionary conditions in key advanced economies.
higher-for-longer, GDP growth, inflation, central banks, economic conditions, 2024
false
Risk Assessment and Management
Financial Services
Mixed Chart
EY
Add to my slides
Remove from favorites
A bar chart showing reasons for switching vehicle brands, using varying shades of teal. The chart includes percentages and is straightforward in layout.
Market Analysis and Trends
Transportation & Logistics
This slide presents reasons why consumers consider switching vehicle brands, with the desire for something different being the most dominant factor. Useful for analyzing brand loyalty and consumer behavior in the automotive sector.
Brand loyalty, consumer behavior, market analysis, vehicle brands, switching reasons
false
Market Analysis and Trends
Transportation & Logistics
Single Chart
Deloitte
Add to my slides
Remove from favorites
A bar chart showing responses to an investment scam during the pandemic, with a small pie chart indicating whether respondents reported the scam to authorities.
Risk Assessment and Management
Financial Services
This slide covers how Canadian investors responded to investment scams during the pandemic, showing percentages of those who invested, realized it was a scam, or reported it to authorities.
scam, investment, pandemic, response, report
false
Risk Assessment and Management
Financial Services
Multiple Chart
IPSOS
Add to my slides
Remove from favorites
A bar chart showing risk scores across various markets and years, with textual content on the left describing the context of digital commerce challenges and operational difficulties.
Market Analysis and Trends
Technology & Software
Explores the impact of digital technologies on operational issues in digital commerce, with specific data on various risks such as crime, logistics, and trade across different markets.
digital commerce, operational risk, technology, market analysis, logistics, trade, crime, consumer risk, operational difficulties, mitigation
false
Market Analysis and Trends
Technology & Software
Mixed Chart
Accenture
Add to my slides
Remove from favorites
A bar chart showing the distribution of self-assessed attitudes towards investment decisions among Canadians in 2023, compared with data from 2022.
Strategic Planning
Financial Services
This slide presents Canadian investors' attitudes towards risk in their investment decisions, comparing data between 2023 and 2022.
Investment, attitude, risk, decisions, Canadians, 2023, 2022
false
Strategic Planning
Financial Services
Mixed Chart
IPSOS
Add to my slides
Remove from favorites
A bar chart showing the economic risks impacting investment plans in Europe, with highlighted percentages and a detailed explanatory text box.
Risk Assessment and Management
Financial Services
The slide highlights the ongoing economic challenges and risks that will impact investment plans in Europe in 2023, such as rising interest rates and inflation.
economic risks, investment, Europe, 2023
false
Risk Assessment and Management
Financial Services
Single Chart
EY
Add to my slides
Remove from favorites
A bar chart showing the expected changes in European footprint in various business areas, with highlighted percentages and an explanatory text box.
Strategic Planning
Financial Services
The slide emphasizes the importance of R&D for inward investment in Europe, presenting survey data on the expected changes in business areas like R&D and manufacturing.
R&D, investment, Europe, business areas
false
Strategic Planning
Financial Services
Mixed Chart
EY
Add to my slides
Remove from favorites
A bar chart showing the percentage distribution of tech-forward companies across various industries. Text discusses the representation of tech-forward companies in different sectors.
Market Analysis and Trends
Technology & Software
The slide provides an analysis of how tech-forward companies are distributed across multiple industries, with a bar chart highlighting sector representation.
Tech-Forward, Industry Distribution, Sector Analysis, Representation, Trends
false
Market Analysis and Trends
Technology & Software
Mixed Chart
Accenture
Add to my slides
Remove from favorites
A bar chart showing the percentage of companies planning to expand or establish operations in Europe, with an explanatory text box providing additional insights.
Strategic Planning
Financial Services
The slide discusses the priority of Europe for companies, indicating plans to establish or expand operations, and highlights the sectors with the highest expansion intentions.
investment, Europe, company plans, expansion
false
Strategic Planning
Financial Services
Mixed Chart
EY
Add to my slides
Remove from favorites
A bar chart showing the percentage of services procurement spend across various industries. Each bar is colored differently, representing sectors like insurance, financial services, and telecommunications.
Industry Overview
Professional Services
Analyzes the proportion of services procurement spending in different sectors, showing higher spend in industries like insurance and financial services compared to sectors like construction or consumer products.
Procurement, Services, Industry, Spend, Analysis
false
Industry Overview
Professional Services
Single Chart
Kearney
Add to my slides
Remove from favorites
A bar chart showing the percentage of time spent on five major finance processes: Close & Reconcile, Consolidate & Report, Accounts Payable, Receivable, Planning & Budgeting, highlighting inefficiencies.
Operational Efficiency
Financial Services
Highlights the processes where the finance team spends the most time, suggesting prioritization of these for digital transformation to improve efficiency and productivity.
finance processes, time management, digital transformation, efficiency, productivity, planning, budgeting, accounts payable
false
Operational Efficiency
Financial Services
Mixed Chart
Deloitte
Add to my slides
Remove from favorites
A bar chart showing the perception of Europe’s attractiveness over three years, with different colors representing varying degrees of increase or decrease.
Market Analysis and Trends
Financial Services
The slide presents survey results on the perceived attractiveness of Europe for investment over a three-year period, indicating overall stability despite challenges.
investment, perception, Europe, survey, stability
false
Market Analysis and Trends
Financial Services
Single Chart
EY
Add to my slides
Remove from favorites
A bar chart showing the timeline of various cement and iron & steel projects incorporating CCUS technology.
Market Analysis and Trends
Industrial & Manufacturing
Details the timeline and progress of CCUS projects in the cement and iron & steel industries.
CCUS, cement, iron, steel, projects, timeline
false
Market Analysis and Trends
Industrial & Manufacturing
Single Chart
Kearney
Add to my slides
Remove from favorites
A bar chart showing the timeline of various power plant projects incorporating CCUS technology.
Market Analysis and Trends
Energy & Utilities
Details the timeline and progress of power plant projects using CCUS equipment for emissions reduction.
CCUS, power plants, projects, timeline, emissions
false
Market Analysis and Trends
Energy & Utilities
Single Chart
Kearney
Add to my slides
Remove from favorites
A bar chart shows the importance of various aspects of public EV charging experiences and payment preferences, with sections color-coded for clarity.
Market Analysis and Trends
Transportation & Logistics
Evaluates consumer priorities for public EV charging, including charging speed and payment methods, informing service improvement and customer satisfaction strategies in the automotive sector.
electric vehicles, charging experience, fast charging, payment methods, consumer preferences, service improvement, automotive industry
false
Market Analysis and Trends
Transportation & Logistics
Mixed Chart
Deloitte
Add to my slides
Remove from favorites
A bar chart shows the percentage of urban consumers intending to travel internationally, compared over two years. There is a clear visual distinction between the years.
Market Analysis and Trends
Hospitality & Tourism
Investigates the intent of consumers from various SEA countries to travel internationally, showing a significant rise and projecting future trends.
international travel, SEA, Singapore, Malaysia, consumer intent, urban consumers, travel trends
false
Market Analysis and Trends
Hospitality & Tourism
Mixed Chart
Bain
Add to my slides
Remove from favorites
A bar chart with gray and blue bars indicating different frequencies of internet usage, labeled for various times.
Market Analysis and Trends
Technology & Software
Highlights the change in internet usage frequency before, during, and after lockdowns, demonstrating a shift in consumer behavior.
internet usage, frequency, lockdown, consumer behavior, shift
false
Market Analysis and Trends
Technology & Software
Single Chart
Bain
Add to my slides
Remove from favorites
A bar chart with horizontal bars showing the importance of various macro risk factors to investors, including Federal Reserve policies and inflation. Includes percentage labels and change indicators.
Risk Assessment and Management
Financial Services
Summarizes investor perspectives on critical macroeconomic risks impacting investment decisions, highlighting the prominence of interest rates, inflation, and geopolitical concerns as top factors.
macro risks, investments, inflation, Federal Reserve
false
Risk Assessment and Management
Financial Services
Single Chart
BCG
Add to my slides
Remove from favorites
A bar chart with overlaid line graph titled "Global buyout fund capital contributions and distributions". It contrasts contributions and distributions from 2005 to Q3 22, with a red line indicating net cash flows. There's a notable shift towards negative net cash flows in the recent quarter.
Investment Analysis
Financial Services
Highlights the trends in capital contributions versus distributions to Limited Partners (LPs) in global buyout funds, key for analyzing fund performance, investor returns, and market health.
Buyout Funds, LPs, Capital Contributions, Distributions, Cash Flows, Fund Performance
false
Investment Analysis
Financial Services
Single Chart
Bain
Add to my slides
Remove from favorites
A bar chart with segments showing digital consumer population in SEA countries for 2021 and new digital consumers in 2022.
Market Analysis and Trends
Retail & E-commerce
Examines Indonesia's leading position in SEA's digital consumer base for 2021, with added numbers for 2022, providing a quick comparative regional analysis.
Indonesia, digital consumers, SEA, market analysis, growth trend
false
Market Analysis and Trends
Retail & E-commerce
Single Chart
Bain
Add to my slides
Remove from favorites
A bar extends across the slide, segmented into various client categories with associated market sizes and wealth management share, presented in a clear, hierarchical manner. The design is simple with a blue color scheme.
Financial Performance
Financial Services
Details the firm's market approach for different client segments across the wealth spectrum, from ultra-high net worth to mass affluent, indicating potential for market expansion.
Wealth Spectrum, Client Segmentation, Market Share
false
Financial Performance
Financial Services
Table
Goldman Sachs
Add to my slides
Remove from favorites
A bar graph and timeline are depicted, contrasting the private funding value across different halves of the years. The visual elements are in shades of blue, offering a stark visual against the white background. The data points are clear, and there is a dotted line indicating a forecasted trend.
Investment Analysis
Financial Services
The slide outlines the growth in deal value in Singapore, making it a preferred investment destination in the region. It provides historical and current data on private funding values, useful for assessing the investment climate and predicting future trends in regional investment activities.
investment, growth, deal value, Singapore, private funding
false
Investment Analysis
Financial Services
Single Chart
Bain
Add to my slides
Remove from favorites
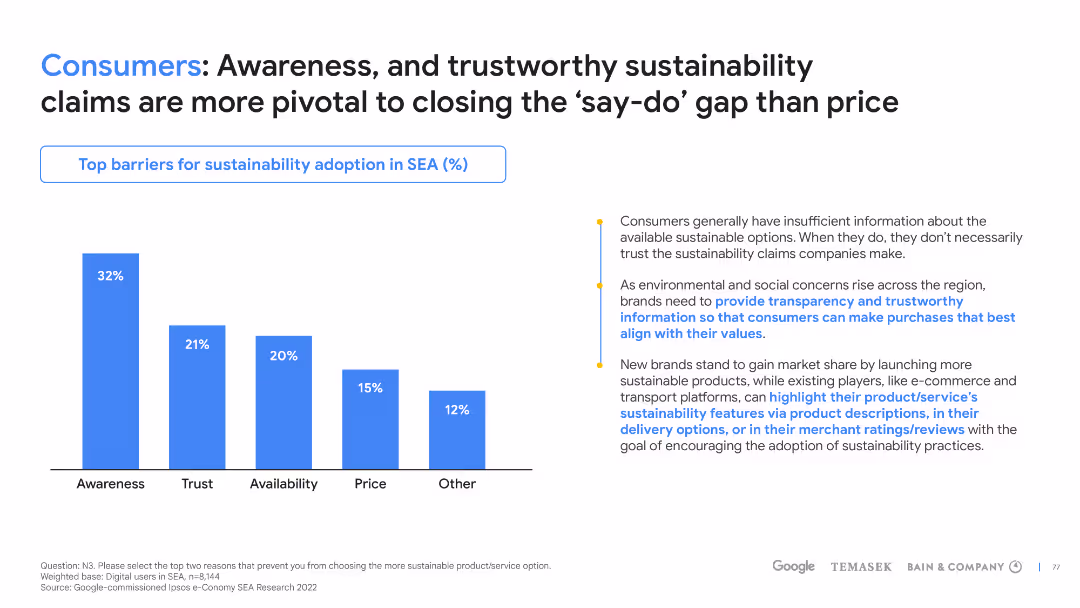
A bar graph centers the slide, depicting the primary barriers to sustainability adoption in SEA, with informative text to the right. The graph uses a single color for clarity, and the textual information is well-integrated, making it easy to follow.
Risk Assessment and Management
Environmental Services & Sustainability
This slide provides insights into the primary obstacles hindering sustainability adoption, with a focus on consumer awareness and trust. It can be utilized in risk management and strategic discussions to address sustainability adoption challenges.
sustainability, adoption barriers, SEA, consumer awareness, trust, strategic planning
false
Risk Assessment and Management
Environmental Services & Sustainability
Mixed Chart
Bain
Add to my slides
Remove from favorites
A bar graph compares the F-Series' revenue with other major consumer products and sports leagues.
Client Case Studies
Transportation & Logistics
Demonstrates the F-Series' revenue size in comparison to well-known products and major sports leagues' combined revenue.
F-Series, consumer products, sports leagues, revenue comparison
false
Client Case Studies
Transportation & Logistics
Single Chart
BCG
Add to my slides
Remove from favorites
A bar graph comparing gross and EBITDA margins across various distribution companies, titled "Distribution businesses can have very different margin profiles."
Financial Performance
Financial Services
This data-driven slide shows the margin profiles of different distribution companies, highlighting the variability in profitability across the sector.
distribution companies, gross margin, EBITDA, profitability, financial performance, bar graph
false
Financial Performance
Financial Services
Single Chart
EY
Add to my slides
Remove from favorites
A bar graph comparing the top ten vehicles sold in the US from 2010-2019.
Client Case Studies
Transportation & Logistics
Communicates the F-Series' position as the highest-selling vehicle in the US over the past decade.
F-Series, highest-selling, vehicle, US market, decade
false
Client Case Studies
Transportation & Logistics
Single Chart
BCG
Add to my slides
Remove from favorites
A bar graph contrasts the percentage of early-stage versus late-stage funding rounds in the technology sector over time, supported by textual analysis.
Investment Analysis
Technology & Software
This slide contemplates the investment pattern shifts in the technology sector over the years, highlighting a move towards more significant later-stage funding rounds. It places this trend within the context of historical cycles, suggesting a consistent pattern of evolution in the sector's investment stages. The graphical representation combined with the analytical text provides a clear and concise overview of how funding preferences have developed, corresponding with industry maturity and investor confidence.
funding trends, later-stage investment, technology sector, market cycles, venture capital
false
Investment Analysis
Technology & Software
Single Chart
Oliver Wyman
Add to my slides
Remove from favorites
A bar graph depicting the global top ten vehicles sold between 2010-2019 with a side image of the F-Series.
Client Case Studies
Transportation & Logistics
Asserts the F-Series as the top-selling pickup globally over the past ten years.
F-Series, best-selling, pickup truck, global market
true
Client Case Studies
Transportation & Logistics
Single Chart
BCG
Add to my slides
Remove from favorites
A bar graph displaying potential revenue increase from agility across various industries, with an 'Estimated average revenue lift' callout box.
Financial Performance
Professional Services
Details how adopting an agile business model is projected to impact revenue across different industries, with a focus on future growth.
Agile Model, Revenue Impact, Industry Comparison, Bar Graph, Future Growth
false
Financial Performance
Professional Services
Single Chart
Kearney
Add to my slides
Remove from favorites
A bar graph displays the number of school days lost in different regions due to COVID-19, with dual-color bars representing fully and partially closed schools.
Market Analysis and Trends
Education & Training
This slide quantifies the educational disruption caused by COVID-19, showcasing the number of school days lost in different regions globally. It highlights the long-term effects on educational equality and economic impact.
COVID-19, education, impact, school closures
false
Market Analysis and Trends
Education & Training
Mixed Chart
Roland Berger
Add to my slides
Remove from favorites
A bar graph displays the percentage of investors' expectations regarding the timing of an economic recession in the US. Colored bars represent different time periods, and percentages are listed atop each bar.
Market Analysis and Trends
Financial Services
The slide presents survey results of investors' beliefs about the timing of the next US recession, with the majority expecting it within the year.
US recession, investor expectations, economic analysis, survey results, 2023 outlook
false
Market Analysis and Trends
Financial Services
Single Chart
BCG
Add to my slides
Remove from favorites
A bar graph highlights the F-Series' revenue in comparison to other notable companies.
Financial Performance
Transportation & Logistics
Shows the F-Series' revenue outperforming that of many major companies in 2019.
F-Series, revenue, companies, financial performance
false
Financial Performance
Transportation & Logistics
Single Chart
BCG
Add to my slides
Remove from favorites
A bar graph highlights the percentage of women enrolled in tertiary education by region for 2018, using different shades to depict each region.
Market Analysis and Trends
Education & Training
This slide explores gender disparities in tertiary education enrollment by region as of 2018, noting that women have overtaken men in most areas. It discusses shifts in gender parity and its implications for global educational trends.
education, gender disparity, tertiary, 2018
false
Market Analysis and Trends
Education & Training
Mixed Chart
Roland Berger
Add to my slides
Remove from favorites
A bar graph illustrates the retention rate of new digital service users, with consistent high percentages across multiple service categories.
Market Analysis and Trends
Technology & Software
Illustrates the longevity of digital service adoption among new users, indicating a low likelihood of market retraction post-pandemic.
digital services, long-term adoption, user retention, market stability, service categories, post-pandemic
false
Market Analysis and Trends
Technology & Software
Single Chart
Bain
Add to my slides
Remove from favorites
A bar graph on the right compares the number of new digital services adopted by consumers during the pandemic years. The left side details the increase in purchases made in digital services.
Financial Performance
Technology & Software
Examines the growing number of digital service purchases made by existing consumers, indicating market growth and the potential for new service development.
consumer purchases, digital services, pandemic, market growth, service development, adoption rates
false
Financial Performance
Technology & Software
Single Chart
Bain
Add to my slides
Remove from favorites
A bar graph showing the percentage spend allocation on different e-commerce categories across several Southeast Asian countries, with clear segmentation.
Market Analysis and Trends
Retail & E-commerce
Analyzes the rise of business messaging as part of digital shopping, giving a breakdown of e-commerce spending across Southeast Asian countries.
business messaging, e-commerce, digital shopping, spend allocation, Southeast Asia, trends, rise, analysis
false
Market Analysis and Trends
Retail & E-commerce
Multiple Chart
Bain
Add to my slides
Remove from favorites
A bar graph slide with horizontal bars of varying lengths indicating levels of focus on different types of work and collaboration. The background is clean, allowing the graph and the descriptive text on the left to stand out. The use of grayscale with selective yellow highlights creates visual interest.
Organizational Structure and Change
Professional Services
This slide examines shifts in collaboration and independent work trends over the past two years. It employs a bar graph to display the proportionate change in focus, serving as an analytical tool for companies reassessing their collaborative practices in light of remote and hybrid work experiences.
Collaboration, Trends, Remote Work, Hybrid Work, Organizational Change
false
Organizational Structure and Change
Professional Services
Single Chart
EY
Add to my slides
Remove from favorites
A bar graph with a horizontal layout shows the percentage of investors' change in risk preference due to increased inflation. It includes a sidebar with notable changes in investing practices. The visual elements are detailed, utilizing contrasting colors to highlight changes over time.
Market Analysis and Trends
Financial Services
Illustrates a shift in investors' risk preferences in response to inflation, highlighting an increase in risk aversion and changes in investment practices. Can be used to discuss investment strategies and market behavior.
Investor Behavior, Risk Aversion, Inflation Impact, Investment Strategies, Market Trends, Risk Management, Cash Holdings, Asset Classes, Portfolio Management, Value Investing
false
Market Analysis and Trends
Financial Services
Multiple Chart
BCG
Add to my slides
Remove from favorites
A bar graph with a percentage breakout showing the prioritization of personalized product offerings by executives.
Market Analysis and Trends
Professional Services
Evaluates the importance placed on personalized products in business strategy, as seen by different company sizes and executive roles.
Personalization, Executive Priorities, Bar Graph, Product Strategy
false
Market Analysis and Trends
Professional Services
Single Chart
Kearney
Add to my slides
Remove from favorites
A bar graph with clear annotations showing the private funding value in Malaysia from 2019 to H1 2023. Colors differentiate the sectors, and the deal count is at the bottom.
Market Analysis and Trends
Financial Services
Demonstrates a downward trend in private funding in various sectors in Malaysia, indicating a shift in investment landscape.
Malaysia, Private Funding, Decline, Sectors, E-commerce, Digital Media, Travel, Investment Landscape, Deal Count
false
Market Analysis and Trends
Financial Services
Single Chart
Bain
Add to my slides
Remove from favorites
A bar graph with text on the left showing the F-Series' market share among vehicles on the road.
Client Case Studies
Transportation & Logistics
States that the F-Series trucks make up a significant percentage of vehicles on the road.
F-Series, popularity, vehicles, market share, US roads
false
Client Case Studies
Transportation & Logistics
Single Chart
BCG
Add to my slides
Remove from favorites
A before-and-after comparison of the old and new design of Citi's Supplier Finance Platform interface, highlighting the improvements.
Product and Service Analysis
Technology & Software
Juxtaposes the old and new user interfaces of a finance platform to demonstrate the enhanced usability and features of the redesign.
finance platform, redesign, user interface, usability, Citi
false
Product and Service Analysis
Technology & Software
Graphic
Citigroup
Add to my slides
Remove from favorites
A blend of column charts and textual information, this slide offers financial growth data and a narrative on client advisory services.
Client Case Studies
Financial Services
This presentation slide shows the growth of wealth management business, client assets, and market share. It also emphasizes the commitment to client advisory and investment strategies tailored to high net worth individuals.
wealth management, client advice, growth, market share, high net worth
false
Client Case Studies
Financial Services
Multiple Chart
Goldman Sachs
Add to my slides
Remove from favorites
A blend of listed principles with a highlighted sidebar, it uses icons for visual emphasis and color coding for distinction between principles.
Human Resources and Talent Management
Technology & Software
It talks about fostering a culture of innovation by rewarding certain behaviors and principles within teams. Relevant for HR and corporate culture initiatives.
Innovation, Culture, Reward, Talent Management, Risk-taking, Ownership, Decision-making, Collaboration, Action Bias
true
Human Resources and Talent Management
Technology & Software
Text Only
BCG
Add to my slides
Remove from favorites
A blue bar chart presents FGA venture investments as a percentage of the technology venture investing market, accompanied by a summary text on the right side.
Market Analysis and Trends
Technology & Software
This analysis slide discusses the minor proportion of FGA venture investments in the technology sector, highlighting trends and specific large deals. It is suited for investment impact analysis.
FGA, Investment, Technology, Market Share, Analysis
false
Market Analysis and Trends
Technology & Software
Mixed Chart
Oliver Wyman
Add to my slides
Remove from favorites
A blue column chart shows the 2019 ROE, followed by incremental changes leading to future ROTE, with blocks indicating contributing factors.
Strategic Planning
Financial Services
This slide plots a strategy for increasing returns, breaking down the contributions of different efficiency and optimization initiatives to ROTE.
ROE, ROTE, returns, litigation, expense efficiencies, funding optimization, client initiatives, financial strategy
false
Strategic Planning
Financial Services
Single Chart
Goldman Sachs
Add to my slides
Remove from favorites
A blue-themed slide with three main sections: Risk and Controls, Operating Model, and Organizational Structure. Each section has bulleted details.
Operational Efficiency
Financial Services
This slide outlines key areas of focus for improving bank operations, highlighting efficiency and simplification.
Modernization, Efficiency, Digitization, Risk Management, Organizational Change, Simplicity
false
Operational Efficiency
Financial Services
Table
Citigroup
Add to my slides
Remove from favorites
A bold design focusing on future prospects with minimalistic text and high contrast colors, emphasizing forward-looking statements.
Strategic Planning
Financial Services
A visionary presentation slide signaling strategic directions and new initiatives for Lloyd's, emphasizing adaptation and innovation in the insurance sector.
future, Lloyd's, strategic direction, insurance industry, innovation
false
Strategic Planning
Financial Services
Multiple Chart
PwC/Strategy&
Add to my slides
Remove from favorites
A bubble chart displaying power generation combined with CCUS projects over time.
Market Analysis and Trends
Energy & Utilities
Emphasizes the role of CCUS in retrofitting various power plants to reduce CO2 emissions.
CCUS, power generation, emissions, retrofit, biomass
false
Market Analysis and Trends
Energy & Utilities
Single Chart
Kearney
Add to my slides
Remove from favorites
A bubble chart showing cement, iron, and steel productions combined with CCUS projects over time.
Market Analysis and Trends
Industrial & Manufacturing
Highlights recent CCUS projects in the cement, iron, and steel industries, and expected future projects.
CCUS, cement, iron, steel, projects, timeline
false
Market Analysis and Trends
Industrial & Manufacturing
Single Chart
Kearney
Add to my slides
Remove from favorites
A bubble chart showing hydrogen production combined with CCUS projects for various industrial applications.
Market Analysis and Trends
Energy & Utilities
Discusses the development of CCUS for blue hydrogen production and its industrial applications.
CCUS, hydrogen, production, industrial, applications
false
Market Analysis and Trends
Energy & Utilities
Single Chart
Kearney
Add to my slides
Remove from favorites
A bubble chart showing the growth and CARG (2020-2025) of different IT services, categorized by 'Run,' 'Build,' and 'Design.' Each bubble represents a service category with varying sizes indicating their market impact.
Technology and Digital Transformation
Technology & Software
This slide illustrates the transition from on-premise to cloud services, highlighting the growth rates and market sizes of different IT service categories, aiding in strategic planning for digital transformation.
On-Prem to Cloud, IT Services, Growth, Digital Transformation, Market Impact
false
Technology and Digital Transformation
Technology & Software
Single Chart
Gartner
Add to my slides
Remove from favorites
A bubble chart showing the timeline and capacity of natural gas processing combined with CCUS projects.
Market Analysis and Trends
Energy & Utilities
Highlights the historical and future significance of natural gas processing in CCS applications.
Natural gas, CCS, timeline, capacity, projects
false
Market Analysis and Trends
Energy & Utilities
Single Chart
Kearney
Add to my slides
Remove from favorites
A bubble chart similar to the previous slide but focused on 'Buy' versus 'Build' strategies. It compares the CARG and growth rates of various IT services, with bubbles sized by market impact.
Strategic Planning
Technology & Software
The slide compares the 'Buy' and 'Build' approaches in IT services, showing growth trends and CARG for different service categories, helping organizations decide on strategic investment directions.
Buy vs Build, IT Services, Growth Rates, Strategic Planning, Market Impact
false
Strategic Planning
Technology & Software
Single Chart
Gartner
Add to my slides
Remove from favorites
A bullet point list of key summaries with a gray and blue color scheme and dollar symbol graphic.
Strategic Planning
Financial Services
Summarizes the potential of US distribution and maintenance markets, fragmentation, and value-added services.
Distribution, MRO, Fragmentation, Value, Margins, Financial Summary
false
Strategic Planning
Financial Services
Agenda
EY
Add to my slides
Remove from favorites
A centered diamond-shaped graphic unites four business sectors, with a blue bar graph showing a case study's results.
Competitive Landscape
Financial Services
Depicts how the firm's integrated approach across various sectors enhances its position as a market maker, demonstrated by a multiplier effect case study.
market maker, integration, business sectors, Goldman Sachs, case study, multiplier effect, competitive advantage
false
Competitive Landscape
Financial Services
Single Chart
Goldman Sachs
Add to my slides
Remove from favorites
A central black board with sections radiating outwards details client priorities and sustainable finance offerings, alongside a narrative of client solutions on the right.
Client Case Studies
Financial Services
Highlights a case study on sustainable finance, showing client priorities and the firm’s sustainable offerings in various business sectors.
Sustainable, Finance, Investment, Asset, Wealth, Management, Solutions, Client
false
Client Case Studies
Financial Services
Table
Goldman Sachs
Add to my slides
Remove from favorites
A central circular diagram with four segments, each representing a different aspect of company culture, surrounded by additional quantitative data.
Organizational Structure and Change
Financial Services
Showcases the firm's cultural strengths and accolades, highlighting factors like client service and partnership through a segmented circle diagram.
talent, culture, service, partnership, integrity
false
Organizational Structure and Change
Financial Services
Framework
Goldman Sachs
Add to my slides
Remove from favorites
A central cloud image with connected icons and text bubbles, facilitating a structured debate on cloud and edge computing.
Technology and Digital Transformation
Technology & Software
Highlights the main topics of debate concerning the future implications and current issues within cloud and edge computing.
cloud computing, edge computing, debate topics, security, sustainability
false
Technology and Digital Transformation
Technology & Software
Header Vertical
McKinsey
Add to my slides
Remove from favorites
A central hexagon labeled "Engineering-centric organization" with arrows pointing to roles like CTO, CPO.
Organizational Structure and Change
Financial Services
Describes the roles and responsibilities within an engineering-centric organization, emphasizing transformation and execution.
organizational structure, transformation, engineering, roles, responsibilities
false
Organizational Structure and Change
Financial Services
Diagram
Credit Suisse
Add to my slides
Remove from favorites
Next
You don't have any favorites yet.
Please wait loading your favorites slides...
Create a FREE account to continue browsing
Receive Instant Access to 7,500+ of the internet's best slides
First Name
Last Name
Email
Password
I agree to all
Terms & Privacy Policy
Thank you! Your submission has been received!
Oops! Something went wrong while submitting the form.
Have an account?
Sign in
Upgrade to PRO to Save slides
Advanced Search and Filters
Access to 8,000+ slides
Access to Category Pages
Save/Bookmark Slides
PowerPoint Template Library
(Coming Soon)
Pick a Plan
MONTHLY
$12/month
Billed every month, Cancel anytime.
YEARLY
$9/year
Billed $108 annually, Cancel anytime.
Checkout for $12/month
Checkout for $108/yr
Secured by Stripe | AES-256 bit encryption