Details
Earnings Results Presentation Third Quarter 2022
Slide type
Mixed Chart
Description
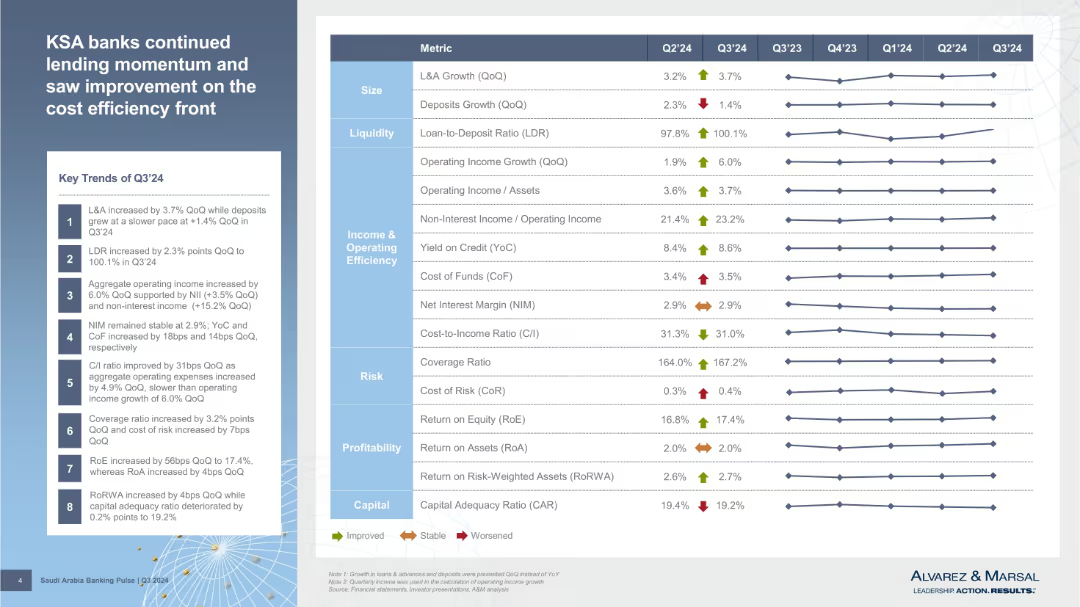
This slide has a dense layout, split between textual financial highlights on the right and detailed tables on the left. The tables and column chart show financial data such as revenues, expenses, and net income, using a color palette of blues and greens to differentiate quarters and business segments.
Use Case
Financial Performance
Industry
Financial Services
Tags
Please submit your feedback here.

Continue browsing similar slides with a FREE account

Receive Instant Access to 7,500+ slides
Thank you! Your submission has been received!
Oops! Something went wrong while submitting the form.
Have an account? Sign in
Mixed Chart
Slides