Details
Morgan Stanley Conference Investor presentation
Slide type
Multiple Chart
Description
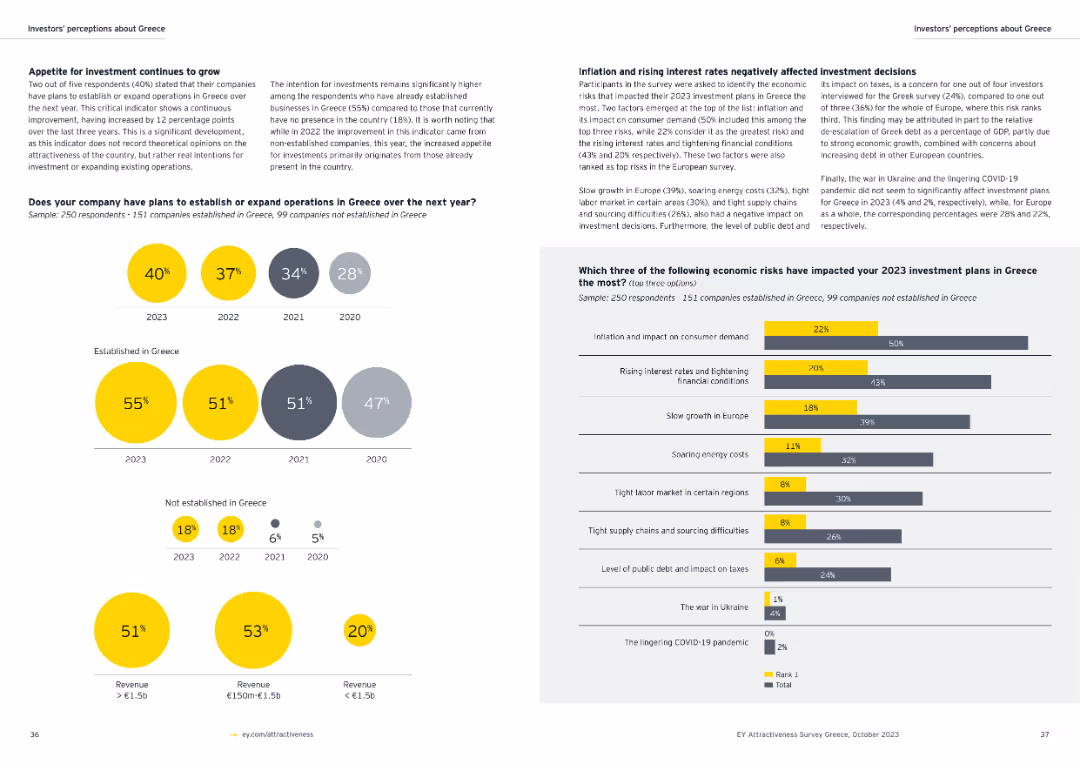
Features a comparative layout with two graphical representations of asset valuations at different times. The first part shows asset values as of December 2021, and the second part shows them for December 2022. Below, a line graph comparing net initial yield by asset class over several years is shown, correlating with German 5Y Bonds for reference. There is an explanatory note and references to valuation reports.
Use Case
Financial Performance
Industry
Real Estate & Construction
Tags
Please submit your feedback here.

Continue browsing similar slides with a FREE account

Receive Instant Access to 7,500+ slides
Thank you! Your submission has been received!
Oops! Something went wrong while submitting the form.
Have an account? Sign in
Multiple Chart
Slides