My Account
My Slides
Search by Category
Templates
View All Templates
Download Template Slides
Leave Feedback
Login
Logout
Get Started
Browse all Slides
Browse all Slides
Create a FREE Account
Instant access to 1,000+ real slides from top companies like McKinsey, BCG, Goldman Sachs, Google and many more!
First Name
Last Name
Email
Password
I agree to all
Terms & Privacy Policy
Thank you! Your submission has been received!
Oops! Something went wrong while submitting the form.
Have an account?
Sign in
Go Back
View source
View source
Details
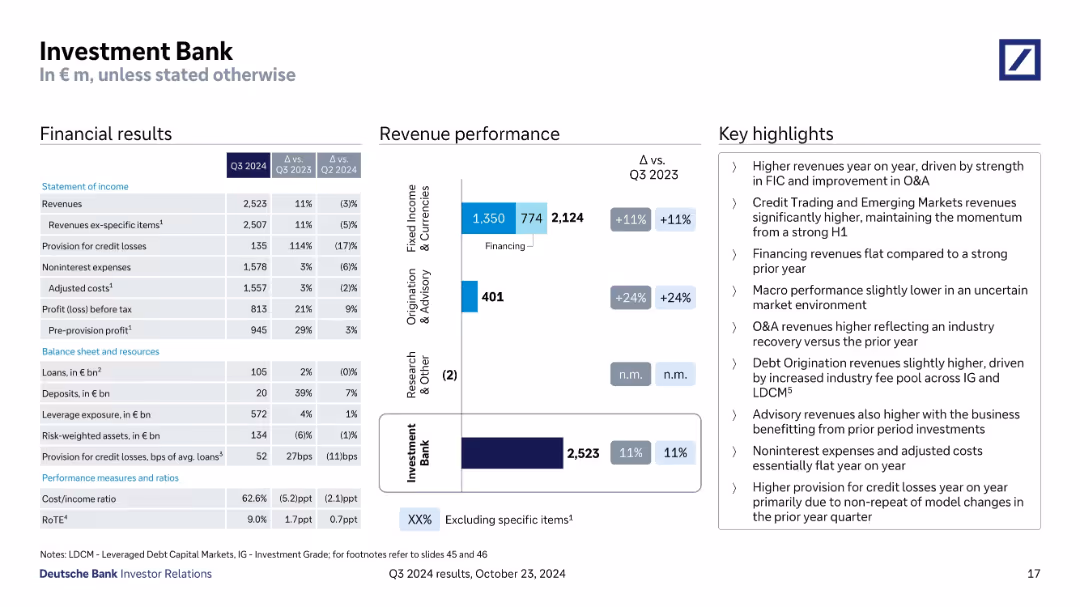
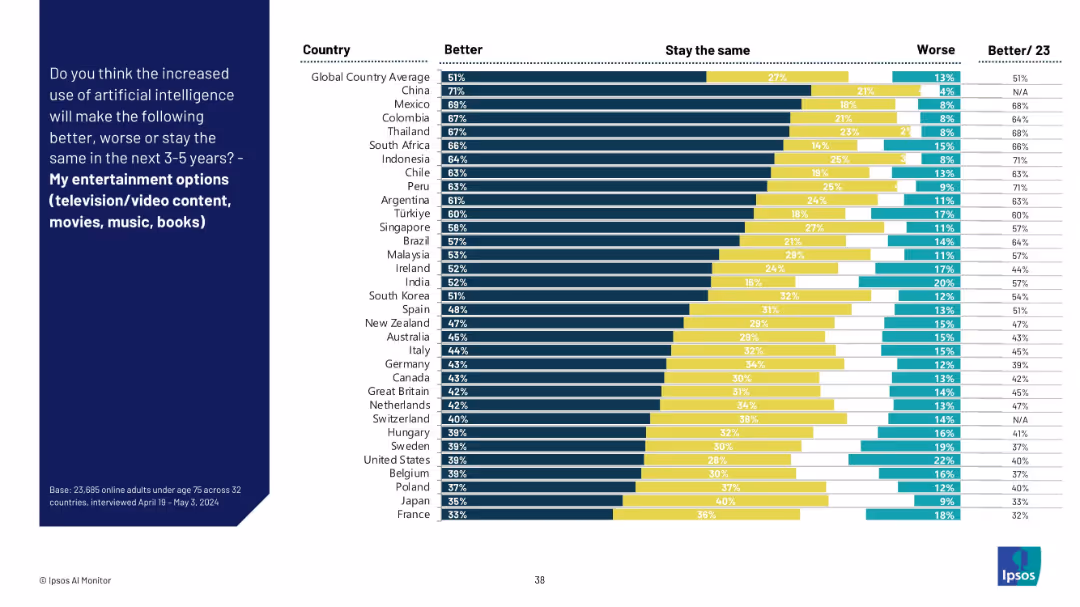
Q3 2023 Fixed Income Investor Conference Call
Slide type
Mixed Chart
Description
Includes column charts depicting financial performance metrics for 9M 2022 and 9M 2023 with comparative analysis and descriptive annotations.
Use Case
Financial Performance
Industry
Financial Services
Tags
Bullet points
Column Chart
View Similar Templates
Please submit your feedback
here
.
Note
: All slides are from public sources.
Add to my slides
Add to my slides
Add to my slides
Saved
Saving to my slides
Continue browsing similar slides with a FREE account
Receive Instant Access to 8,000+ slides
First Name
Last Name
Email
Password
I agree to all
Terms & Privacy Policy
Thank you! Your submission has been received!
Oops! Something went wrong while submitting the form.
Have an account?
Sign in
Spark Your Next Big Idea with New Presentation Templates
Go to Templates
Related
Mixed Chart
Slides
Load More
Instant access to the internet's best slides
Get access to 40+ advanced filters and more
Advanced Search and Filters
Access to
10,000+ slides
Access to Category Pages
Save/Bookmark Slides
PowerPoint Template Library (New)
Choose your plan
MONTHLY
$12/month
Billed every month, cancel anytime.
YEARLY
$9/month
Billed $108 annually, cancel anytime.
Checkout for $12/month
Checkout for $108/yr
Secured by Stripe | AES-256 bit encryption