Details
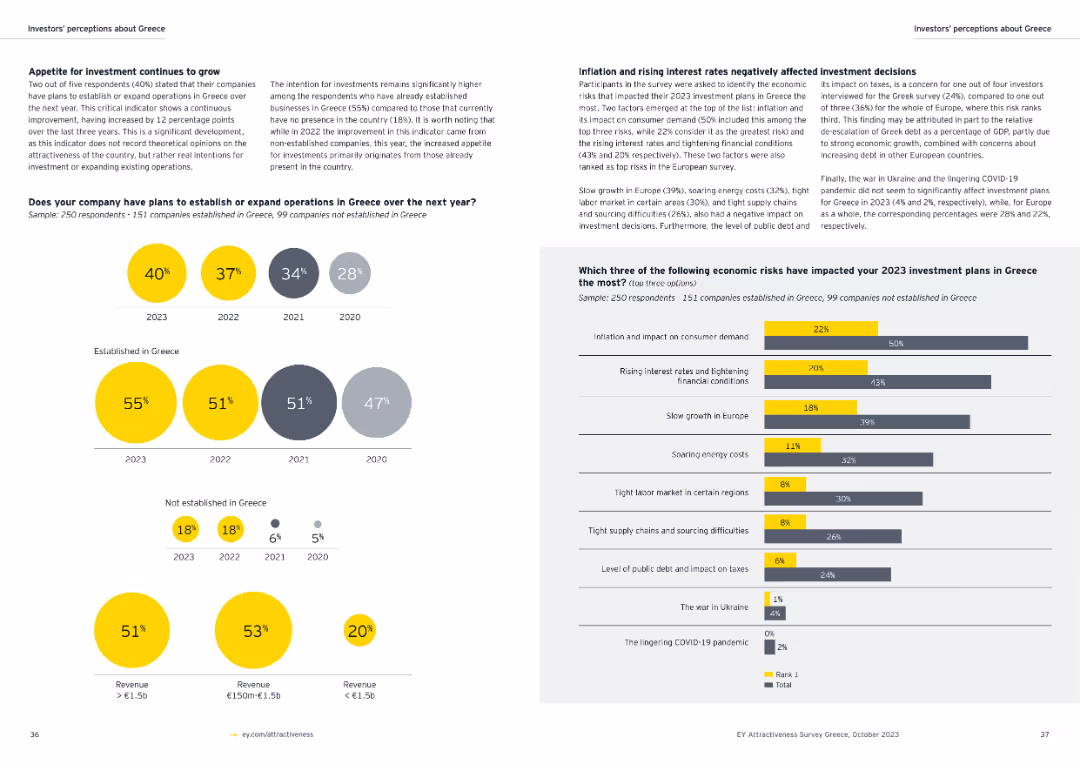
Developing sustainable carbon circularity Looking at advanced applications and business models
Slide type
Multiple Chart
Description
The slide presents a column chart comparing the bioenergy sustainable potential against current energy consumption in different sectors (energy, transport, industry, buildings). Each sector's contribution to CO2 reduction is highlighted.
Use Case
Market Analysis and Trends
Industry
Energy & Utilities

Continue browsing similar slides with a FREE account

Receive Instant Access to 8,000+ slides
Thank you! Your submission has been received!
Oops! Something went wrong while submitting the form.
Have an account? Sign in
Multiple Chart
Slides

Instant access to the internet's best slides

Get access to 40+ advanced filters and more
Advanced Search and Filters
Access to 8,000+ slides
Access to Category Pages
Save/Bookmark Slides
PowerPoint Template Library (Coming Soon)

Choose your plan

Secured by Stripe | AES-256 bit encryption