My Account
My Slides
Search by Category
Templates
Leave Feedback
Login
Logout
Get Started
Browse all Slides
Browse all Slides
Create a FREE Account
Instant access to 1,000+ real slides from top companies like McKinsey, BCG, Goldman Sachs, Google and many more!
First Name
Last Name
Email
Password
I agree to all
Terms & Privacy Policy
Thank you! Your submission has been received!
Oops! Something went wrong while submitting the form.
Have an account?
Sign in
Go Back
View source
View source
Details
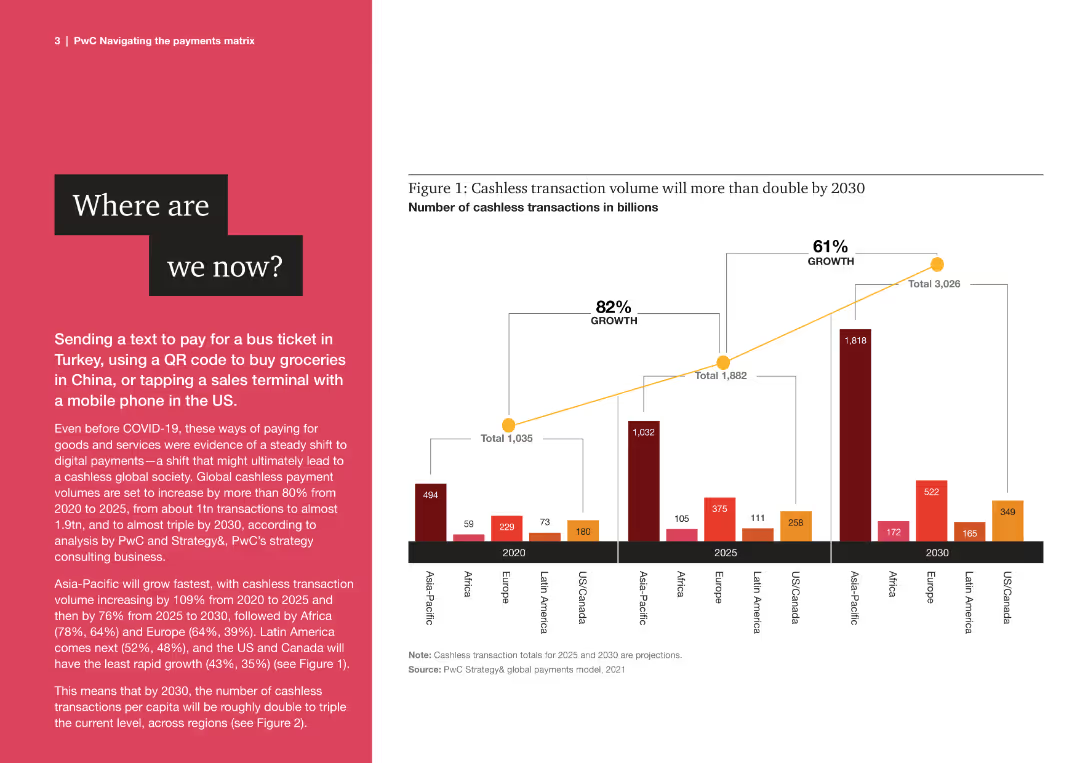
Hydrogen applications and business models
Slide type
Mixed Chart
Description
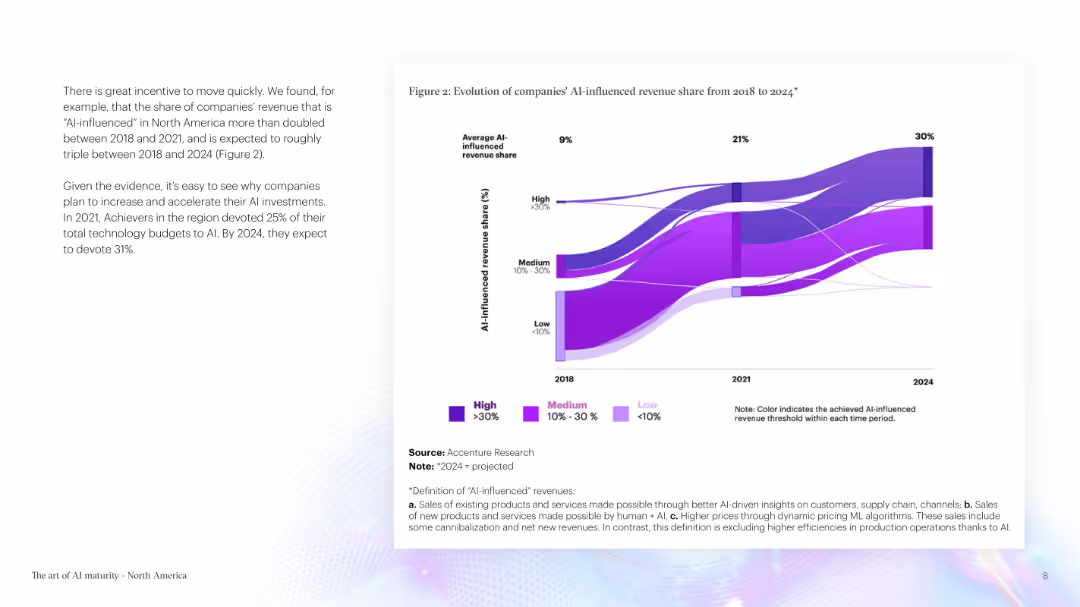
The slide uses a line chart to show the relationship between CAC vs. CO₂ emissions from electricity generation in 2030 across various countries. Detailed and focused.
Use Case
Regulatory and Compliance
Industry
Energy & Utilities
Tags
Bullet points
Line Chart
Icon
Add to my slides
Add to my slides
Add to my slides
Saved
Saving to my slides
Please submit your feedback
here
.
Note
: All slides are from public sources.
Continue browsing similar slides with a FREE account
Receive Instant Access to 8,000+ slides
First Name
Last Name
Email
Password
I agree to all
Terms & Privacy Policy
Thank you! Your submission has been received!
Oops! Something went wrong while submitting the form.
Have an account?
Sign in
Related
Mixed Chart
Slides
Load More
Instant access to the internet's best slides
Get access to 40+ advanced filters and more
Advanced Search and Filters
Access to
10,000+ slides
Access to Category Pages
Save/Bookmark Slides
PowerPoint Template Library (New)
Choose your plan
MONTHLY
$12/month
Billed every month, cancel anytime.
YEARLY
$9/month
Billed $108 annually, cancel anytime.
Checkout for $12/month
Checkout for $108/yr
Secured by Stripe | AES-256 bit encryption