My Account
My Slides
Leave Feedback
Login
Logout
Get Started
Browse all Slides
Browse Slides Pro
Create a FREE Account
Instant access to 1,000+ real slides from top companies like McKinsey, BCG, Goldman Sachs, Google and many more!
First Name
Last Name
Email
Password
I agree to all
Terms & Privacy Policy
Thank you! Your submission has been received!
Oops! Something went wrong while submitting the form.
Have an account?
Sign in
Go Back
View source
View source
Details
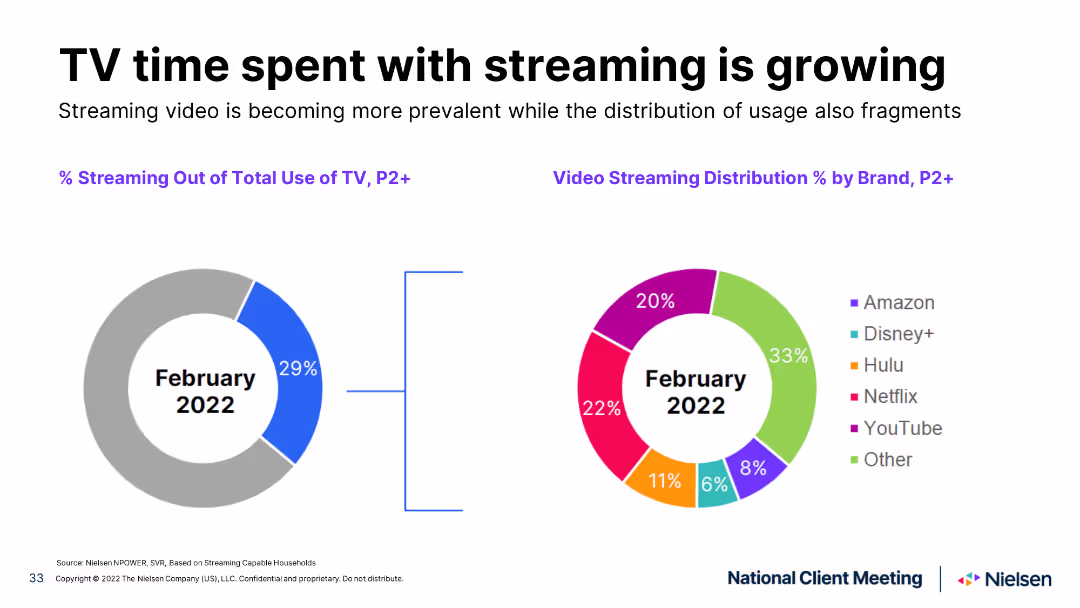
Spring 2022 National Client Meeting
Slide type
Multiple Chart
Description
Pie chart slide showing the percentage of TV time spent streaming in February 2021 and February 2022, with distinct color segments for different streaming services.
Use Case
Market Analysis and Trends
Industry
Media & Entertainment
Tags
Pie Chart
Add to my slides
Add to my slides
Add to my slides
Saved
Saving to my slides
Please submit your feedback
here
.
Note
: All slides are from public sources.
Continue browsing similar slides with a FREE account
Receive Instant Access to 8,000+ slides
First Name
Last Name
Email
Password
I agree to all
Terms & Privacy Policy
Thank you! Your submission has been received!
Oops! Something went wrong while submitting the form.
Have an account?
Sign in
Related
Multiple Chart
Slides
Load More
Instant access to the internet's best slides
Get access to 40+ advanced filters and more
Advanced Search and Filters
Access to
8,000+ slides
Access to Category Pages
Save/Bookmark Slides
PowerPoint Template Library (Coming Soon)
Choose your plan
MONTHLY
$12/month
Billed every month, cancel anytime.
YEARLY
$9/month
Billed $108 annually, cancel anytime.
Checkout for $12/month
Checkout for $108/yr
Secured by Stripe | AES-256 bit encryption