Details
Going Public EY Global Blockchain Summit 2020
Slide type
Mixed Chart
Description
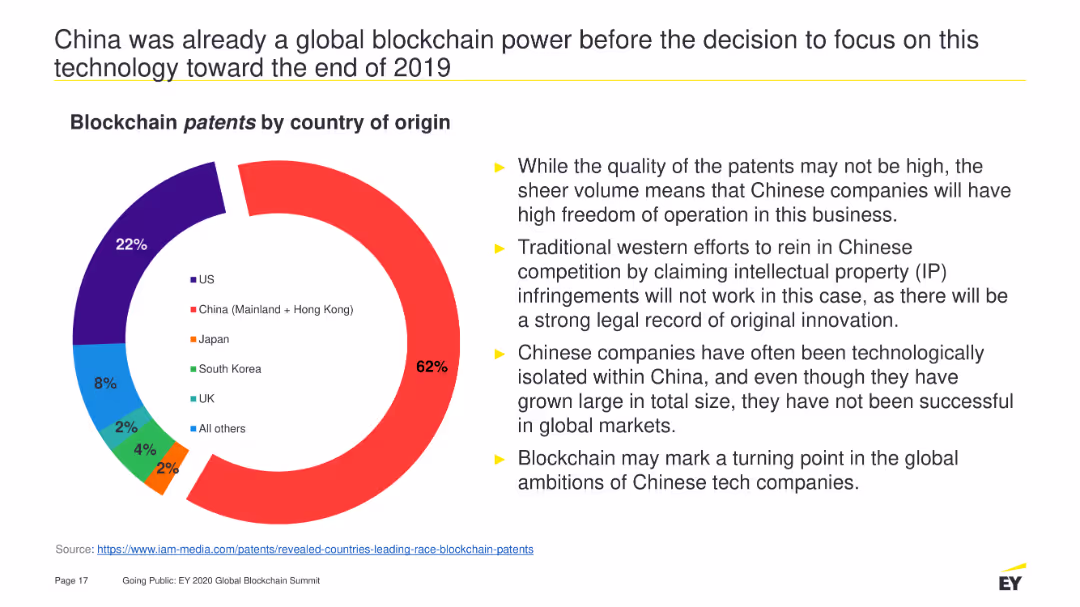
A pie chart depicting the distribution of blockchain patents by country of origin. It is visually dominated by China's portion (62%), followed by the US (22%), Japan (8%), and other countries with smaller percentages. The slide also contains bullet points summarizing the implications.
Use Case
Market Analysis and Trends
Industry
Technology & Software
Tags
Please submit your feedback here.

Continue browsing similar slides with a FREE account

Receive Instant Access to 7,500+ slides
Thank you! Your submission has been received!
Oops! Something went wrong while submitting the form.
Have an account? Sign in
Mixed Chart
Slides