EY Price Point: global oil and gas market outlook Q3 | July 2020
Slide type
Multiple Chart
Description
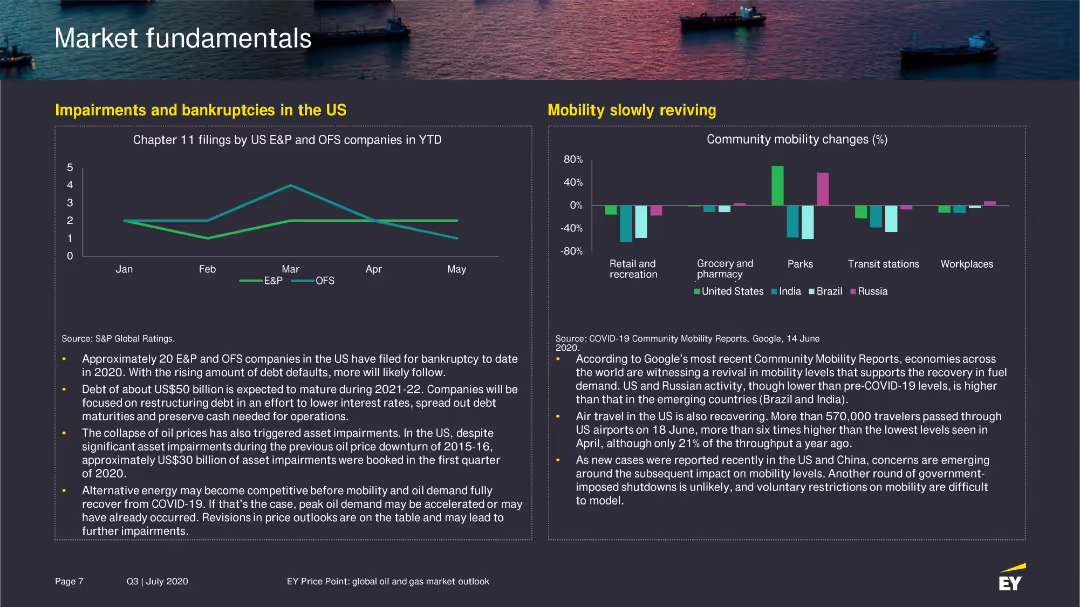
The slide features a line chart showing Chapter 11 filings by US E&P and OFS companies in 2020 and a bar chart illustrating changes in community mobility in various sectors.